Monday, August 26, 2024

SlowStartUpdate20240826

Slowest Start to East PACific Season since 1977

as of 0806 or 6 August 2024

Update as of 0826 or 26 August 2024


I calculate Year-To-Date (YTD) TC activity every day in both hemispheres and make three kinds of plots for the current 2024 NHEM season:
The basins I follow in NHEM are:
  • EPAC -- Eastern north PACific (includes the central PAC)
  • WPAC -- Western north PACific
  • LANT -- north atLANTic
  • IO -- north Indian Ocean (both the Bay of Bengal and the Arabian Sea)
My TC activity metrics are slightly different than ACE (Accumulated Cyclone Energy) and are calculated YTD (units in [] Vmax is the NHC/JTWC intensity) and for the entire season (yearly):
  • sTCd  [days]-- scaled TC days accumulate every 6 h 
    • TC = ( (Vmax * 6 h) / Vmax ) * (24 h /day) 
  • sACEd [days] -- scaled ACE days accumulate every 6 h:
    •  when Vmax >= 35 kts ACE = ((Vmax*Vmax*6h)/(35*35kts)*(24h/d)
  • sHUACEd [days] -- scaled HUrricane ACE days accumulate every 6 h when Vmax >= 65 kts ACE = ( (Vmax*Vmax*6h)/(65*65kts) * (24h/d)
ACE is typically expressed in Tjoules but I prefer units that are more natural to me, i.e., why I scale to make the units days.  Otherwise, my sACEd is identical to the standard ACE.  

sTCd is my original time-intensity metric that avoids sensitivity to the accuracy of Vmax ... why I'm not a big fan of Kerry Emanuel's power metric.  Regardless, ACE is the de facto standard.

The anomaly is expressed as a percent departure from a 30-y climatology 19990101-20201231.  For the YTD anomalies, the climatology is calculated from the beginning of the season 0101 to the YTD.  In this blog 0101-0806 or 1 January - 6 AugustThis is the 0101-0826 update.

At the end of the season (YYYY1231 for NHEM and YYYY0630 for SHEM) the YTD TC activity is the total activity for the year.  

I compare the YTD (20240806) activity (1977-2024) to the annual (1976-2023) to show how early-season anomalies differ from those of the full season.  The anomaly unit is % and the metric is sACEd.  For example, if the actual sACEd is 30 d and the climatology is 15 d, the anomaly would be 100%

YTD EPAC v LANT as of 20240806 -- 0826 update


Looking at my maps every day, I noticed that as of 6 August 2024 the EPAC YTD sACEd anomaly was very, very low at -93 % as of 26 August is -49%. I did some quick python and matplotlib to see if it was lower in the past and found this current value is a record going back to 1977.  NB: the obs in EPAC were not very good in the late 70, 80s.  The python was updated today to plot two basins and calculate statistics.

Here is a comparison of EPAC v LANT as of 0806:

Fig. 1 YTD (0806) anomalies EPAC v LANT

The 0826 update:

Fig. 1a YTD (0826) anomalies EPAC v LANT


In contrast to the EPAC, the LANT is above normal, but not a YTD record for 0806.    Note the negative correlation of -0.33 between EPAC and LANT anomalies.

Current YTD anomalies as of 0826:

EPAC: -49%
LANT: +83%

Only 2005 LANT season had a faster start...with a record anomaly of 491%!

The LANT has slowed down considerably since 0806

There is a noticeable trend in the LANT (orange line) for the 2005 -- present era -- more early-season activity.  My guess is that NHC is calling early storms (often subtropicals) more often than before 2006 because of better satellite data.  Coincidentally I worked at NHC 2006-2008 as the lead Tech Dev...

YTD EPAC v WPAC as of 20240806 -- 0826 update


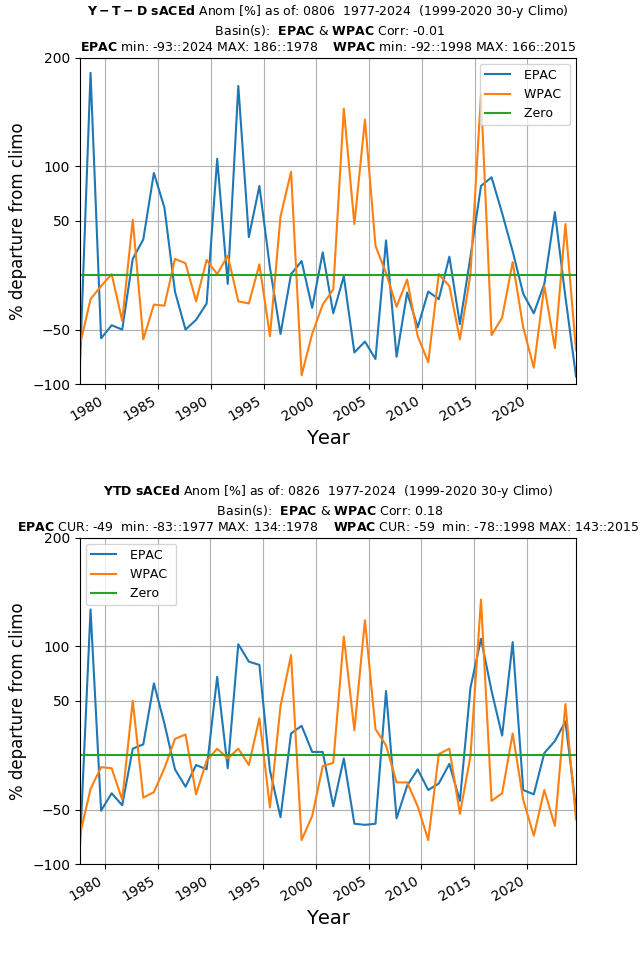
I also noticed that the NHEM activity was low as well -- because WPAC was very low as shown below comparing YTD EPAC v WPAC:

Fig.2 YTD anomalies EPAC v WPAC

The 0826 update:

Fig.2a YTD anomalies EPAC v WPAC as of 0826


The WPAC season is still below normal at -59% as of 0826 v -69% as of 0806


YTD EPAC v LANT v WPAC as of 20240826 -- 0806 v 0826 gif


Here are gif versions comparing 0806 to 0826


Fig.1b YTD anomalies EPAC v LANT -- 0806 v 0826

Fig.2b YTD anomalies EPAC v WPAC -- 0806 v 0826


Season EPAC v LANT v WPAC for 1976-2023


Here are the same plots as in Figs. 1 & 2 but now for the entire season.

Fig. 3. As in Fig. 1a but for the annual/season anomalies


Fig. 4. As in Fig. 2a but for the annual/season anomalies


Summary of YTD v season - EPAC v LANT


Here is a summary of the stats:

EPAC v LANT Year-To-Date (0806) 1977-2024:
Corr: -0.33
EPAC CUR:  -93%  min: -93% in 2024; max: 186% in 1978
LANT CUR +350%. min: -97% in 1988; max: +491% in 2005

EPAC v LANT Year-To-Date (0826) 1977-2024:
Corr: -0.33
EPAC CUR: -49%  min: -93% in 2024; max: 186% in 1978
LANT CUR: +85%  min: -97% in 1988; max: +491% in 2005

EPAC v LANT YEARly 1976-2023:
Corr: -0.37
EPAC min: -83% in 1977; max: +139% in 2018
LANT min: -84% in 1983; max +132% in 2005

Note the negative correlation of ~ -0.3 between EPAC and LANT anomalies for both YTD and seasonally.  

Summary of YTD v season - EPAC v WPAC


In the meantime, WPAC is off to a slow start as well as of 0806 (-69% v -93% in EPAC).  


EPAC v WPAC Year-To-Date (0806) 1977-2024:
Corr: -0.02
EPAC CUR: -93%  min: -93% in 2024; max: +186% in 1978
WPAC CUR: -75%  min: -92% in 1998; max: +166% in 2015


EPAC v WPAC
 Year-To-Date (0826) 1977-2024:
Corr: +0.18
EPAC CUR: -49%  min: -93% in 2024; max: +186% in 1978
WPAC CUR: -59%  min: -92% in 1998; max: +166% in 2015


EPAC v WPAC YEARly 1976-2023:
Corr: +0.42
EPAC min: -83% in 1977; max: +139% in 2018
WPAC min: -65% in 1999; max: +124% in 1997

On a yearly basis, WPAC/EPAC anomalies are relatively well correlated at +0.42, but not YTD for 0806.  As of 0826, however, the correlation is now positive at 0.18.

Generally, August WPAC activity is ahead of EPAC/LANT (putting on my JTWC TDO hat)

Conclusions


This curious early season activity is just that.  We're moving into the peak of the NHEM season and there will be changes in TC activity, but what's happening in EPAC (the season peaks earlier than in the LANT) will be interesting to follow...

As of 0826, the LANT activity essentially stopped.  The old rule of thumb is that there is always a storm in the LANT on Labor Day.  If the current (0826) NHC 7-d forecast verifies, then this year's Labor Day (2 September) would be one of the rare times there is no storm... 


Tuesday, August 6, 2024

SlowStartEPAC

Slowest Start to East PACific Season since 1977

as of 0806 or 6 August 2024


I calculate Year-To-Date (YTD) TC activity every day in both hemispheres and make three kinds of plots for the current 2024 NHEM season:
The basins I follow in NHEM are:
  • EPAC -- Eastern north PACific (includes the central PAC)
  • WPAC -- Western north PACific
  • LANT -- north atLANTic
  • IO -- north Indian Ocean (both the Bay of Bengal and the Arabian Sea)
My TC activity metrics are slightly different than ACE (Accumulated Cyclone Energy) and are calculated YTD (units in [] Vmax is the NHC/JTWC intensity) and for the entire season (yearly):
  • sTCd  [days]-- scaled TC days accumulate every 6 h 
    • TC = ( (Vmax * 6 h) / Vmax ) * (24 h /day) 
  • sACEd [days] -- scaled ACE days accumulate every 6 h:
    •  when Vmax >= 35 kts ACE = ((Vmax*Vmax*6h)/(35*35kts)*(24h/d)
  • sHUACEd [days] -- scaled HUrricane ACE days accumulate every 6 h when Vmax >= 65 kts ACE = ( (Vmax*Vmax*6h)/(65*65kts) * (24h/d)
ACE is typically expressed in Tjoules but I prefer units that are more natural to me, i.e., why I scale to make the units days.  Otherwise, my sACEd is identical to the standard ACE.  

sTCd is my original time-intensity metric that avoids sensitivity to the accuracy of Vmax ... why I'm not a big fan of Kerry Emanuel's power metric.  Regardless, ACE is the de facto standard.

The anomaly is expressed as a percent departure from a 30-y climatology 19990101-20201231.  For the YTD anomalies, the climatology is calculated from the beginning of the season 0101 to the YTD.  In this blog 0101-0806 or 1 January - 6 August.

At the end of the season (YYYY1231 for NHEM and YYYY0630 for SHEM) the YTD TC activity is the total activity for the year.  

I compare the YTD (20240806) activity (1977-2024) to the annual (1976-2023) to show how early-season anomalies differ from those of the full season.  The anomaly unit is % and the metric is sACEd.  For example, if the actual sACEd is 30 d and the climatology is 15 d, the anomaly would be 100%

YTD EPAC v LANT v WPAC as of 20240806


Looking at my maps every day, I noticed that as of 6 August 2024 the EPAC YTD sACEd anomaly was very, very low at -93 %.  I did some quick python and matplotlib to see if it was lower in the past and found this current value is a record going back to 1977.  NB: the obs in EPAC were not very good in the late 70, 80s.  The python was updated today to plot two basins and calculate statistics.

Here is a comparison of EPAC v LANT:

Fig. 1 YTD (0806) anomalies EPAC v LANT


In contrast to the EPAC, the LANT is above normal, but not a YTD record for 0806.    Note the negative correlation of -0.33 between EPAC and LANT anomalies.

Current YTD anomalies:

EPAC: -93%
LANT: +209%

Only 2005 LANT season had a faster start...with a record anomaly of 491%!

There is a noticeable trend in the LANT (orange line) for the 2005 -- present era -- more early-season activity.  My guess is that NHC is calling early storms (often subtropicals) more often than before 2006 because of better satellite data.  Coincidentally I worked at NHC 2006-2008 as the lead Tech Dev...

I also noticed that the NHEM activity was low as well -- because WPAC was very low as shown below comparing YTD EPAC v WPAC:

Fig.2 YTD anomalies EPAC v WPAC

Season EPAC v LANT v WPAC for 1976-2023


Here are the same plots as in Figs. 1 & 2 but now for the entire season.

Fig. 3. As in Fig. 1 but for the annual/season anomalies


Fig. 4. As in Fig. 2 but for the annual/season anomalies


Summary of YTD v season - EPAC v LANT


Here is a summary of the stats:

EPAC v LANT Year-To-Date (0806) 1977-2024:
Corr: -0.33
EPAC min: -93% in 2024; max: 186% in 1978
LANT min: -97% in 1988; max: +491% in 2005

EPAC v LANT YEARly 1976-2023:
Corr: -0.37
EPAC min: -83% in 1977; max: +139% in 2018
LANT min: -84% in 1983; max +132% in 2005

Note the negative correlation of ~ -0.3 between EPAC and LANT anomalies for both YTD and seasonally.  

Summary of YTD v season - EPAC v WPAC


In the meantime, WPAC is off to a slow start as well (-69% v -93% in EPAC).  


EPAC v WPAC Year-To-Date (0806) 1977-2024:
Corr: -0.02
EPAC min: -93% in 2024; max: +186% in 1978
WPAC min: -92% in 1998; max: +166% in 2015

EPAC v WPAC YEARly 1976-2023:
Corr: +0.42
EPAC min: -83% in 1977; max: +139% in 2018
WPAC min: -65% in 1999; max: +124% in 1997

On a yearly basis, WPAC/EPAC anomalies are relatively well correlated at +0.42, but not YTD for 0806.  By August, WPAC activity is generally ahead of EPAC/LANT.


Conclusions


This curious early season activity is just that.  We're moving into the peak of the NHEM season and there will be changes in TC activity, but what's happening in EPAC (the season peaks earlier than in the LANT) will be interesting to follow...


Friday, May 10, 2024

Intro to the superBT

 A super Best Track (BT) for Tropical Cyclone (TC) Forecasting and Research

https://github.com/tenkiman/superBT-V04/ 

Mike Fiorino

George Mason University

mfiorino@gmu.edu

8 December 2023

10 May 2024

8 August 2024


Introduction

The superBT is a TC data set first developed and implemented when I was a visiting professor at the University of Tokyo in 2022.  Since my visit, and after nearly two years of quality control and application development, the first 'beta' version has been recently released A more complete documentation is: README-sbt-v04.md 

These presentations at AORI in October 2022 and for the Huracan project kickoff meeting in March 2023 and the 2024 INDOPACOM Tropical Cyclone Conference give more science and technical details:

What is a superBT?

The superBT is a TC-centric superposition of reanalysis (NWP-dynamics) and precipitation (thermodynamics) datasets onto TC track data from the two US operational forecasting centers:  the Joint Typhoon Warning Center (JTWC), Pearl Harbor HI and the National Hurricane Center (NHC), Miami FL. The superBT can be thought of as a Best Track dataset with additional variables related to TC intensity and structure change (e.g., vertical wind shear and rainfall).

A special property of the superBT is that it includes a curated and unique set of both developing (9Xdev) and non-developing (9Xnon) pre/potential TCs (pTCs). Genesis is defined either as the first TC position in the best track or the time of the first warning/advisory.  Both JTWC and NHC are required to issue warnings/advisories on systems analyzed to be a TC regardless of initial intensity (maximum surface wind speed). Unlike IBTrACS, or the JTWC/NHC best tracks, the superBT TC (NN - 0-50) includes positions from the pTC (9Xdev) that became the TC.

Another special property of the superBT is the use of the twice-daily 10-d forecasts from the latest ECMWF Reanalysis v5 - ERA5.  The GFDL tracker (Marchok 2021) is run to generate TC track forecasts.  The quality of the ERA5 analyses, for TC applications, is assessed by the 'acid test of an analysis' i.e., a ‘good’ track forecast implies a ‘good’ analysis.  

The ERA5 forecast tracks are also used in calculating the ‘diagnostic’ file of environmental and storm parameters that are input to statistical-dynamical intensity prediction models (e.g., Knaff et al. 2019).  The tracks are also used to compare ERA5 model precipitation around the TCs in the superBT to three satellite precipitation analyses.


The basic properties of the V04 first beta version are: 

  • 2007-2022 – 16-y data set
  • Final BT JTWC:2007-2021; NHC 2007-2022
  • Global - NHEM & SHEM basins
  • TC position and structure from both the JTWC/NHC - best tracks (“bdeck”) & aid files (“adeck”)
  • NN - operationally designated TCs
  • 9Xdev - pre/potential TC (pTC) that developed into NN or TC (developers)
  • 9Xnon - pre/potential TC (pTC) that did not develop (non-developers)
  • ERA5 reanalysis forecasts for storm and large-scale diagnostics
  • Three global high-resolution precipitation analyses: NCEP-CMORPHJAXA-GSMaP & NASA-IMERG


Some Technical Details


The superBT consists of six .csv data files. The table below gives a description with links:

file name

description

# of lines-header

all-md3-2007-2022-MRG.csv

positions for NN/9Xdev/9Xnondev 

107050 # posits

sum-md3-2007-2022-MRG.csv

summary of each storm

5233 # of storms

sbt-v04-2007-2022-MRG.csv

superBT

86595 # posits

h-meta-md3-vars.csv

metadata for all-md3-*.csv

32 variables

h-meta-md3-sum-vars.csv

metadata for sum-md3-*.csv

25 variables

h-meta-sbt-v04-vars.csv

metadata for sbt-v04*.csv

66 variables

superBT-V04.tgz

zip file with all .csv + doc


NB: the number of positions in the all-md3* file does not equal the number of positions in the superBT file because full storm (NN files) includes both 9X & NN postions. There is a superBT position for all unique positions.

The github distribution at: https://github.com/tenkiman/superBT-V04 also includes a py2 directory with python2 applications for listing and analyzing the superBT data files.  Details of the applications will be linked in the home page above in the near future.  Two examples of unique and special analyses that can be done with the superBT are show below to motivate potential use in TC research.


Two Applications

Perhaps the most unique aspect of the superBT is the curated tracks of pTCs (9Xdev or TC 'seeds') that developed into numbered storms (NN) and those that did not (9Xnon).  All TCs (NN) begin as disturbances or pTCs.  These systems are tracked to initiate satellite reconnaissance and to start the warning/forecast process at JTWC/NHC.  Started an 'INVEST' or '9X' (the two-character pTC ID that ranges from 90-99) has no cost to the operational centers and has evolved over the years as forecasters have improved their ability to identify a pTC that has 'significant' potential to develop.

The curation process ensures the correct identification of the 9Xdev that became an NN storm, the elimination of large track jumps (6-h speed > 30 kts) and mislocation of 9Xnon.  In some cases, the 9Xdev may not be in the same basin as the NN storm.  For example, a storm in EPAC (Eastern north PACific) the formed from an atLANTic storm that crossed Central America or a CPAC (Central north PACific) storm crossing the dateline into the WPAC (Western north PACific).  There is even a case of a TC in the LANT making it all the way to WPAC!  For this case three centers were involved in the warning process (NHC, Central Pacific HC and JTWC).

Formation Rate & lifetime of 9Xdev v 9Xnon

The first obvious question is the formation rate or the percentage of all 9X that became NN TCs.  The formation rate has changed during the 15-y period 2007-2022, but over the last five years the year-to-year change has been relatively similar.  Fig. 1 below shows the formation rate in WPAC is ~50% or that of the 302 9X 150 developed.  The mean lifetime of 9Xdev is 3.6 d and for 9Xnon 3.1 d.

Figure 1.  Histogram of lifetime (days) of 9Xnon (red) v 9Xdev (green) in WPAC 2018-2022 (the plot label is incorrect).  The mean life of 9Xdev is 3.6 d and 9Xnon 3.1 d.

Also noteworthy are the many cases of both 9Xdev and 9Xnon lasting more than 1 week... Table 1 below gives a summary for the 4 major basins:

Table 1. Formation rate and mean 9Xdev v 9Xnon lifetime for the major basins 2018-2022

Basin

Formation Rate [%]

9Xdev lifetime [d]

9Xnon lifetime [d]

LANT

62

2.9

2.9

EPAC

72

2.9

2.8

WPAC

50

3.6

3.1

SHEM

44

4.1

2.8

and in the animated GIF in Fig. 2.

Figure 2. Loop of the histograms for the four major basins.

The Southern HEMisphere has the lowest formation rate and EPAC the highest, but what is more interesting from a forecaster perspective is that both 9Xdev and 9Xnon last about 3 d before becoming an NN TC or dissipating

Structural Differences between 9Xdev v 9Xnon - Vertical Wind Shear

The next obvious question is if there are detectable differences in dynamical (e.g., vertical wind shear) and thermodynamical (precipitation) properties of the pTCs before either formation or dissipation.  

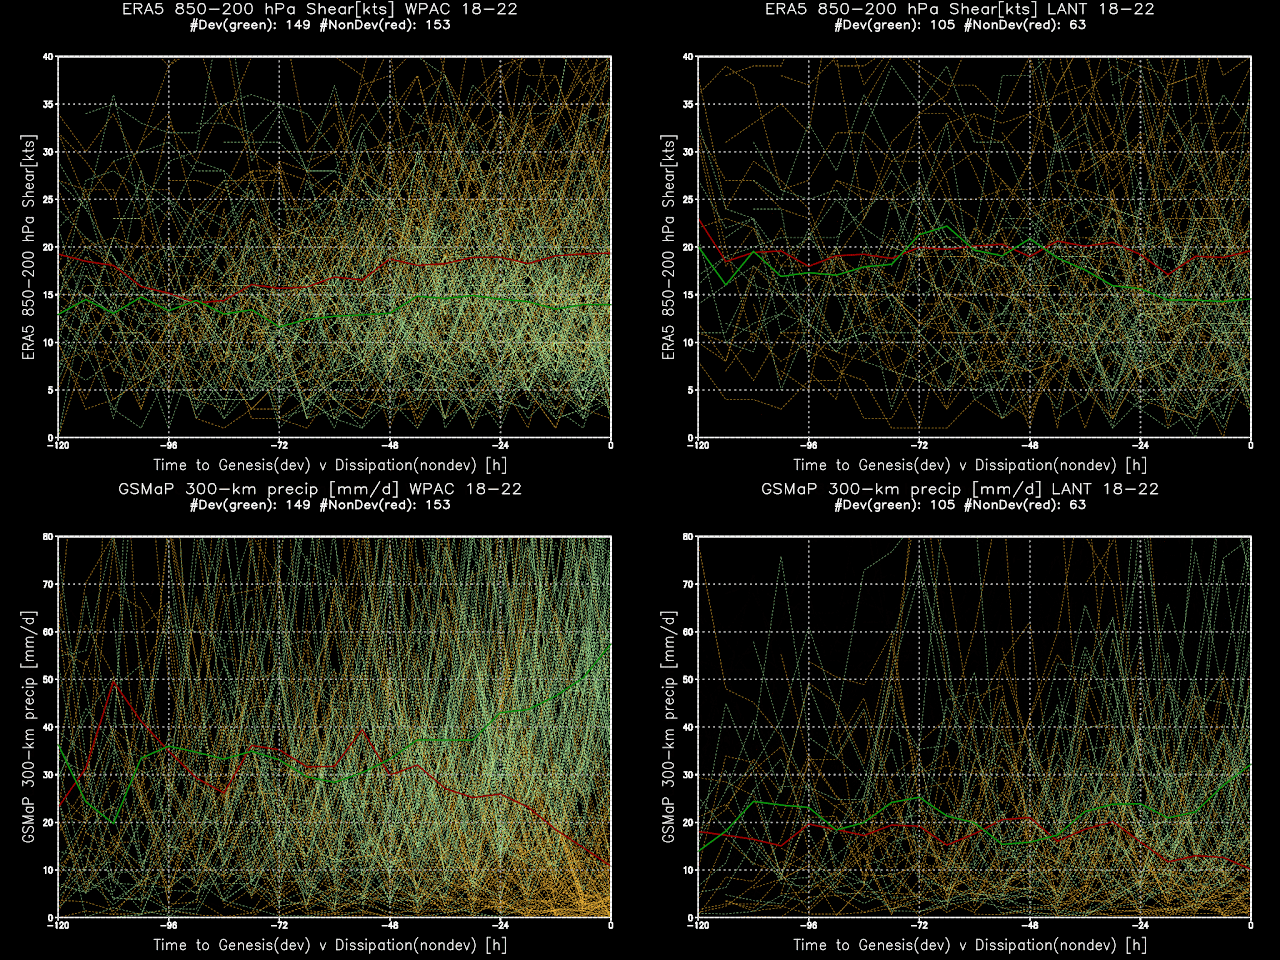
Fig. 3 shows the 850-200 hPa vertical wind shear (VWS) for the 9X in WPAC in the 2018-2022 5-y period.

Figure 3. Time series of the VWS for all 9Xdev (green) v 9Xnon(red) in WPAC 2018-2022.

About 80 h before formation/dissipation both 9Xdev and 9Xnon VWS is about 14 kts - the 'departure time'.  The 9Xnon VWS increases whereas for 9Xdev it remains about 15 kts.  

JTWC forecaster experience in WPAC is that a VWS of 15 kts is critical or that VWS less than 15 kts is favorable for development/intensification and greater that 15 kts is unfavorable.  The ERA5 reanalyses confirm this forecaster 'rule of thumb'.

The LANT is a different story as can be seen in Fig. 4.

Figure 4. As in Fig.3 except for LANT 2018-2022.


The two big differences are: 
  1. VWS is 5 kts higher in the LANT 
  2. departure time in the LANT is -48 h but -80 h in WPAC
Much of the differences can be explained by the mean latitude of formation in the LANT being about 10 deg poleward from that latitude in WPAC and monsoonal formation (WPAC) v tropical waves TC formation (LANT).

Structural Differences between 9Xdev v 9Xnon - Precipitation r=300 km


We next consider the thermodynamical differences defined by the rain rate in the r=0-300 km annulus from the Japan JAXA GsMAP precipitation analyses.  The superBT also has mean rain rates in the r=500 & 800 km circles centered on the TC.  The r=300 mean is more representative of the inner core whereas r=800 km the large-scale environment.

Figure 5.  Mean precipiation rate in the r=300 km circle centered on the TC position from the GsMAP for WPAC 2018-2022.


In WPAC for r=300 km (Fig. 5) we see a mean rate of about 30 mm/d almost doubling to 55 mm/d at genesis for 9Xdev and dropping to 12 mm/d at dissipation.  The time when the 9Xdev diverges from 9Xnon is about -44 h.

As with the VWS, there is a marked difference in the LANT in Fig. 6.

Figure 6. As in Fig.5 except for LANT

The departure time is also -44 h in the LANT, but the rain rates are about 35% less than in WPAC.  The LANT-WPAC difference is again most likely related to different TC formation mechanisms in the basins.

The diurnal cycle in the mean precipitation (solid lines) for both 9Xdev and 9Xnon can be seen as well.  The peak in the LANT is about -30 h and about -18 h in WPAC which is consistent with local time...  Interesting...
 

Figure 7. Loop of rain & VWS between LANT and WPAC.


Fig. 7 loops VWS and rain rate to visually compare the WPAC and LANT basins which can be summarized as: 
  1. departure time for rain is about -44 h in both basins
  2. VWS is 5 kts higher in the LANT (20 kts) than in WPAC (15 kts) 
  3. rain is about 35% stronger in WPAC (related to lower VWS?)
  4. departure time for VWS is about -80 h in WPAC, but -48 h in the LANT

Discussion


The superBT is a unique and hopefully useful TC data set for both operations and research.  The initial analysis shows that about 50% of all 9X or pTCs form into numbered NN TCs and that there are clear differences between developing 9Xdev and non-developing 9Xnon pTCsPrecipitation rate almost doubles 48 h before genesis and VWS decreases about 48 h before genesis.  We also found clear differences between WPAC and the LANT; undoubtedly related to differences in formation.

The first final release of the superBT -- V10 -- will extend back to 1999 and include 2023 for a 24-y data set.  More importantly data on TC structure will be added, in particular R34 (radius of 34 kt winds) -- a measure of TC size/strength.

Acknowledgements


Professor Yukari Takayabu of AORI and TouDai (now retired) sponsored and hosted my visit in 2022.  I am deeply appreciative of her constant support and encouragement both during the visit and especially through the long COVID delay.  Hans Hersbach, ERA5 project manager provided access from 1963-present to the ERA5 forecasts.  I am very grateful for his support of my ECMWF account and discussions on ERA5.  Kamahori-san of AORI was particularly helpful in understanding TC precipitation -- the primary thermodynamical forcing of tropical cyclones.  

Dr. Jim Kinter of George Mason University supports my affiliation with GMU and access to university computer and library resources.  

Finally, all calculations were done on my home PC that is at least 100X more powerful the mainframes I made my first TC NWP forecast in 1977 at Penn State as a student of Rick Anthes and Tom Warner.  These two professors were instrumental in my 40+ year career as an NWP and TC modeler. I would not be where I am today without their guidance and support.

References


Knaff, J. A., C. J. Slocum, and K. D. Musgrave, 2019: Quantification and Exploration of Diurnal Oscillations in Tropical Cyclones. Monthly Weather Review, 147, 2105–2121, https://doi.org/10.1175/MWR-D-18-0379.1.
Marchok, T., 2021: Important Factors in the Tracking of Tropical Cyclones in Operational Models. Journal of Applied Meteorology and Climatology, 60, 1265–1284, https://doi.org/10.1175/JAMC-D-20-0175.1.


SlowStartUpdate20240826

Slowest Start to East PACific Season since 1977 as of 0806 or 6 August 2024 Update as of 0826 or 26 August 2024 I calculate  Year-To-Date (Y...